“Clinical documentation is the cornerstone of medical data and the foundation of patient care. It provides a lasting record of the patient’s history, diagnoses, tests, and treatments. An accurate and complete health record is beneficial not only to ensure that the severity and risk of illness of the patient is accurately reflected, but it also benefits the patient-provider relationship and aids in population health management and research. In addition, accurate clinical documentation and subsequent coding can help ensure appropriate reimbursement and reporting of quality metrics under value-based purchasing methodologies.”1
It is the goal of every clinical documentation integrity (CDI) and coding professional to produce a complete patient story. CDI departments diligently review records, query providers, and follow documentation to ensure it is clarified to the greatest specificity. Medical coding professionals at every level and in every setting build deep, comprehensive code sets to capture the complete clinical picture.
In spite of this collective effort, the aggregate medical data is not painting a complete picture of population health trends in chronic disease processes. A coded medical record with 25 or fewer diagnosis codes can produce a true picture of these trends, but charts with more than 25 diagnoses may understate patient complexity due to a claims formatting issue. Advanced sequencing logic (ASL) enhanced grouper software takes a hierarchical approach, considering variables beyond traditional complications and comorbidities (CC) and major CC (MCC) capture.
Components of the Patient Story
In a value-based world, documented diagnoses are used beyond historical reimbursement models. Risk adjustment methodologies are prolific in the environment, and each may use diagnoses differently by including or excluding conditions or assigning various weights and importance to the same diagnosis.
Documentation, clarified by CDI, which is then translated into code sets by coding professionals, creates valuable claims data. These data sets are analyzed by various entities who draw conclusions about quality of care based on how listed diagnoses, present on admission (POA) designations, severity of illness (SOI)/risk of mortality (ROM) values, social determinants of health (SDOH), potentially preventable readmissions (PPRs), potentially preventable complications (PPCs), and patient safety indicators (PSIs) interact.
These conclusions are published according to parameters defined by Centers for Medicare and Medicaid Services (CMS) measures, Star Rating Program, Healthcare Effectiveness Data and Information Set (HEDIS) measures, and mortality models using observed over expected mortality ratios.
Even when a code set is perfectly derived, it may not always paint a holistic patient picture when received by Medicare, because software does not order code sets with more than 25 diagnosis codes to prioritize sequencing of the most impactful codes into the top 25 positions. Priority codes not sent to CMS are excluded from subsequent analysis and can contribute to understated patient severity at both the claims and aggregate level. ASL software solves the problem of highly weighted diagnoses falling below the 25th position on a claim.
Transformational Software
ASL software assists in telling the patient story by prioritizing codes and sequencing diagnoses that incorporate both financial and quality of care perspectives into the top 25 diagnoses reported on a claim. This embedded sequencing logic is transformational to the industry. Reporting high-priority diagnoses on the final claim contributes not only to accurate reimbursement but also addresses expected outcomes and risk-adjusted algorithms and contributes to correctly benchmarking overall population health.
Institutions wishing to prioritize top 24 secondary diagnoses must currently resort to a manual process. Staff must perform the time intensive operational task of manual sequencing, which reduces coding professionals’ productivity. This manual process requires in-depth knowledge of various risk methodologies and is subject to human error due to risk of inconsistency in assigning priority to the unique code set derived for each patient. Manual sequencing requires initial training and then retraining of staff when models change. It also requires monitoring the landscape for methodologies that update on different schedules. Additionally, if a manually sequenced code set is reopened by others downstream in the revenue cycle process, there is no guarantee the most impactful sequencing derived by thoughtful manual placement will remain. The “reopening” action will often “reset” the diagnosis order to the default setting of the software, and all upstream work is lost in the process.
Many CDI programs publish reports based on change in diagnosis-related group (DRG) relative weight. This reporting capability often aligns with vendor software created for a “fee for service” world. CDI programs reviewing documentation for all diagnoses relevant to the patient often obtain clarification for diagnoses impacting various quality models. Departmental reports for these programs may be “homegrown” and crafted to report capture of diagnoses impacting risk methodology beyond SOI/ROM. Yet, once again, if the clarified diagnoses fall below the 25th position, they will not be additive to the completeness of the code set. In essence, this may leave CDI programs “overstating” the actual quality impact to a chart. A diagnosis may be clarified by CDI, and it may fall on the final code set, but if a priority diagnosis is not guaranteed to fall in the top 25 diagnoses on a claim because submitted data is limited to 24 secondary diagnoses, the diagnoses cannot ultimately add value to statistical risk algorithms.
Revenue cycle professionals strategically review records with an understanding of how resultant code sets are used by outside entities to draw conclusions about patient care outcomes. It is not feasible for CDI programs to publish internal reports based on a process that requires reconciling final derived code sets to determine the position of quality diagnoses reported on a claim. The work to produce this data would be too labor intensive to operationalize. Yet without this level of reconciliation, CDI reports may overstate the degree of quality diagnoses captured through documentation clarification.
Claims data used to determine DRG payment is also used to calculate penalties associated with value-based methods of payment. Analyzing code sets through the lens of various payment methodologies allows conclusions to be drawn about patient outcomes and quality of care. Facility and provider performance ratings are also partially ranked according to reported diagnoses. Coded data sets are also mined for use in medical research.
With data being important for all of these functions, technology that doesn’t sequence the most impactful diagnoses may be understating the complete patient story. Elements that reflect true severity of illness, risk of mortality, acute and chronic illness, SDOH, and expected mortality may be in derived code sets but not on the claim and, therefore, out of the patient story. Is it possible to make the picture clearer—maybe even crystal clear?
Advanced Sequencing Logic
ASL’s hierarchical software behavioral model conceptually challenges the next generation of software to consider variables beyond traditional MCC and CC capture.

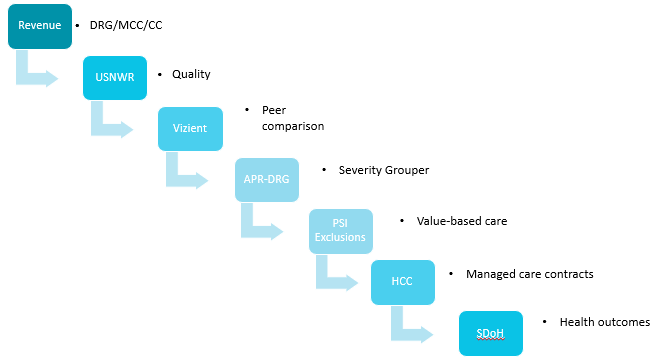
For example, once an appropriate DRG is derived, what should be considered next? Quality as defined by U.S. News and World Report? Peer comparison via the lens of Vizient, Truven, or Premier? Severity grouper conclusions from APR-DRG SOI/ROM? Where should PSI exclusions and inclusions fall to benchmark value-based initiatives? Managed care organizations need robust information about hierarchical condition category (HCC) conditions for assignment of per member per month (PMPM) payments. Data mining must ensure information about social determinants of health is not left underreported as the industry looks to address disparities and inequity in healthcare.
Proof of Concept
Duke Health posed a challenge to our current software vendor (3M Health Information Systems). Revenue cycle leadership from CDI and coding knew CDI queried to improve the integrity of the medical record and worked in close collaboration with coding to report a thorough code set. Therefore, we concluded, neither documentation nor coding quality were roadblocks to establishing a complete patient picture. If documentation was comprehensive and coding was accurate, why did our quality outcomes demonstrate a less complex patient population than the one Duke Health serves?
Our hypothesis was that the reported patient story is adversely affected by the position of a diagnosis on the claim. Missing or incomplete documentation or inadequate coding is not the root cause for a seemingly less complex patient population.
We studied a sample population using data from 9,182 CDI-reviewed records from Medicare/Medicare Advantage payers to determine the percentage of accounts with more than 25 diagnoses; understand how diagnoses were positioned on those accounts; and identify the percentage of charts with quality-impacting diagnoses below position 25 on the submitted claim.
Of the 9,182 records in the sample, 27 percent had more than 25 diagnoses, 73 percent contained diagnoses relevant to Agency for Healthcare Research and Quality (AHRQ) data, and 99 percent contained diagnoses relevant to reporting Elixhauser comorbidities.

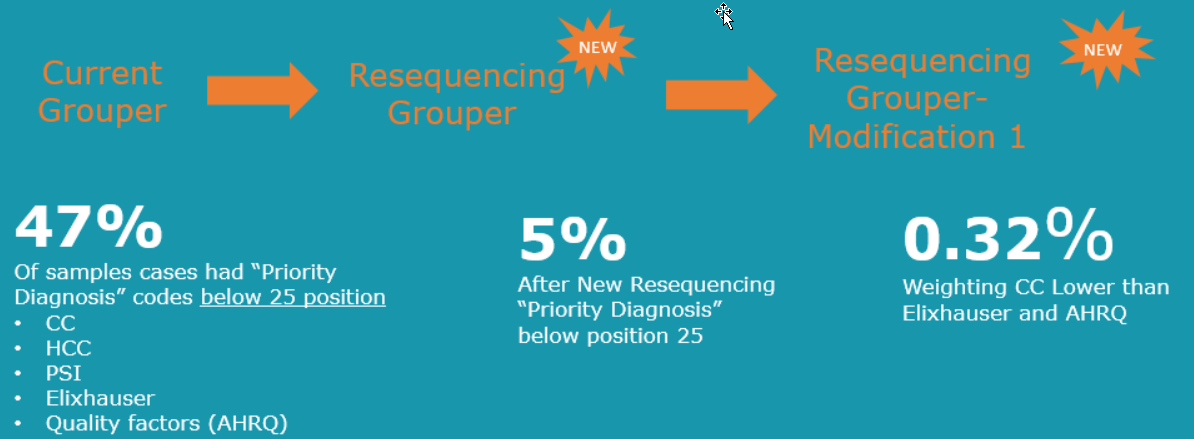
Drilling down further, we performed analysis on charts containing more than 25 diagnoses. Of the 27 percent of sampled charts with more than 25 diagnoses [N=2508], 47 percent of those had priority diagnoses below position 25 on the claims. These diagnoses represented CC, HCC, PSI, Elixhauser, and AHRQ weighted conditions. Stated another way, 47 percent of the sample charts with 25 diagnoses or more [N=1178] had diagnoses impacting quality models that never made it to Medicare for analysis.
We realized if a diagnosis never populates Medicare’s Standard Analytic File (SAF) or Medicare Provider Analysis and Review (MedPAR) data, it also never crosses to those agencies that are looking to draw conclusions about patient outcomes.
This finding supports the hypothesis that quality diagnoses clarified by CDI and reported by coding professionals were missing from data sets received by Medicare. A possible root cause of lower-than-expected quality outcomes might be the number of impactful quality diagnosis codes falling below position 25 on the claim, and therefore they were never received by Medicare and Medicare Advantage for analysis.
Code Sequencing Improvement
Opportunity for resequencing diagnoses was addressed by engaging technology and assigning priority matrices to diagnoses falling across multiple risk methodologies. The derived algorithm, with new weighted priorities, was applied to the original sample size [N=2508].
Applying new sequencing functionality resulted in marked improvement, elevating impactful diagnoses to within the top 24 secondary diagnoses reported on a claim. Analyzing the sample size containing cases with impactful diagnoses below the twenty-fourth position on the claim resulted in only 5 percent of cases with impactful diagnoses below position 25. Further modifications improved that percentage to 0.32 percent of cases with impactful diagnoses below position 25—or, in other words, with 99.68 percent of impactful diagnosis reported within the top 24 secondary diagnoses.

Next Generation Coding Software Is On the Horizon
With preliminary proof of concept complete, steps are underway with 3M Health Information Systems to refine their software through testing and comparing code sets “before” and “after” application of the resequencing grouper (ASL).
Pilot comparative data sets show positioning of diagnoses that reflect excellence in documentation, accurate quality coding, and assignment of the most appropriate MS-DRG and APR-DRG. The resultant data sets include diagnoses that address various risk methodologies, including expected mortality. Most importantly, a prioritized code set reports a complete patient story, reflecting the accurate quality of patient care provided.
Notes
- AHIMA/ACDIS. “Compliant Clinical Documentation Integrity Technology Standards.” December 7, 2021. https://share.hsforms.com/1jzIjgFaPQVSQ_udN-fuHtA4q0h2
Jennifer Nicholson (jennifer.nicholson@duke.edu) is the director of hospital coding and coding integrity at Duke Health in North Carolina.
Deborah Squatriglia (deborah.squatriglia@duke.edu) is an Association of Clinical Documentation Integrity Specialists (ACDIS) Leadership Council member and director of clinical documentation at Duke Health.
By Jennifer Nicholson, MEd, RHIA, CCS, CCDS, CDIP, RRT, and Deborah Squatriglia, BSN, MS, MBA, CCDS, CDIP
Take the CE Quiz